Infrared spectroscopy (IR spectroscopy) is a vital analytical technique used in organic chemistry. It helps identify the functional groups and molecular structures of organic compounds by measuring the absorption of infrared light. Understanding IR spectroscopy is essential for analyzing chemical reactions and determining the structure of molecules.
I. Basics of Infrared Spectroscopy
A. Principle of Infrared Spectroscopy
Infrared spectroscopy measures how molecules absorb infrared light. When a molecule absorbs infrared light, the bonds within the molecule vibrate. These vibrations can be stretching, bending, or twisting. Different bonds absorb different frequencies of infrared light. By measuring these frequencies, we can determine which types of bonds are present in a molecule.

B. Vibrational Modes
1. Stretching Vibrations
Stretching vibrations involve the movement of atoms along the axis of the bond that connects them. This movement results in either the lengthening or shortening of the bond distance.
Symmetric Stretching: Two or more bonds expand and contract simultaneously, maintaining the molecule's symmetry.
Example: In CO2CO2, both C=O bonds stretch in and out simultaneously.
Asymmetric Stretching: The bonds do not stretch equally. One bond may contract while the other expands.
Example: In CO2CO2, one C=O bond lengthens while the other shortens.
2. Bending Vibrations
Bending vibrations involve changes in the angles between bonds in a molecule. There are four primary types of bending vibrations:
- Scissoring: This happens when two atoms move towards and away from each other within the same plane, resembling the motion of scissors.
- Example: In ethylene (C2H4C2H4), the H atoms move towards and away from each other within the molecule's plane.
- Rocking: Occurs when two atoms move in the same direction within the same plane, resembling a rocking chair motion.
- Example: In ethylene (C2H4C2H4), the H atoms move back and forth in the same direction.
- Wagging: Occurs when two atoms move up and down out of the plane, resembling the wagging of a dog's tail.
Example: In the methylene group (CH2CH2), the H atoms move up and down out of the plane of the molecule. - Twisting: This happens when two atoms move out of the plane in opposite directions, resembling the twisting of a towel.
Example: In the methylene group (CH2CH2), one H atom moves up while the other moves down out of the plane of the molecule.
II. Interpreting IR Spectra

A. Functional Group Identification
Each functional group has a characteristic absorption range in an IR spectrum. For instance:
- O-H Stretching: This appears around 3200-3600 cm⁻¹. It is broad and strong.
- C=O Stretching: This appears around 1700 cm⁻¹. It is sharp and strong.
- C-H Stretching: This appears around 2800-3000 cm⁻¹. It is strong and can be sharp or broad.
B. Fingerprint Region
The region between 600-1400 cm⁻¹ is known as the fingerprint region. It contains complex absorptions unique to each molecule. This region helps distinguish between different compounds, even if they have similar functional groups.
III. Examples of IR Spectra
A. Alcohols and Phenols
Alcohols show a broad O-H stretch around 3200-3600 cm⁻¹. Phenols, which are a type of alcohol, also show a similar broad peak.
For example, ethanol (C₂H₅OH) has a broad O-H stretch around 3400 cm⁻¹.
B. Aldehydes and Ketones
Both aldehydes and ketones show a strong C=O stretch around 1700 cm⁻¹. Aldehydes also show C-H stretches near 2700-2900 cm⁻¹.
For example, formaldehyde (CH₂O) has a strong C=O stretch around 1720 cm⁻¹.
C. Carboxylic Acids
Carboxylic acids show a broad O-H stretch around 2500-3300 cm⁻¹ and a strong C=O stretch around 1700 cm⁻¹.
For example, acetic acid (CH₃COOH) has a broad O-H stretch and a strong C=O stretch around these regions.
IV. Applications of Infrared Spectroscopy
A. Identifying Unknown Compounds
By comparing the IR spectrum of an unknown compound to reference spectra, chemists can identify the functional groups present. This helps in determining the structure of the compound.
B. Monitoring Chemical Reactions
IR spectroscopy can monitor the progress of a chemical reaction. For example, the disappearance of a C=O stretch in a ketone and the appearance of an O-H stretch can indicate the reduction of the ketone to an alcohol.
V. Sample Preparation
A. Solid Samples
Solid samples are often ground into a fine powder and mixed with a substance like potassium bromide (KBr) to form a pellet. The KBr is transparent to infrared light, ensuring it doesn't interfere with the sample's IR spectrum.
B. Liquid Samples
Liquid samples are placed between two salt plates. It is usually made of sodium chloride (NaCl) or potassium bromide (KBr). These plates are transparent to infrared light and do not absorb IR radiation, which prevents interference with the sample's spectrum.
C. Gas Samples
Gas samples are contained in a gas cell with windows made of materials like sodium chloride (NaCl) or potassium bromide (KBr), which do not absorb infrared light. The gas cell must be sealed to avoid contamination and loss of the gas sample.
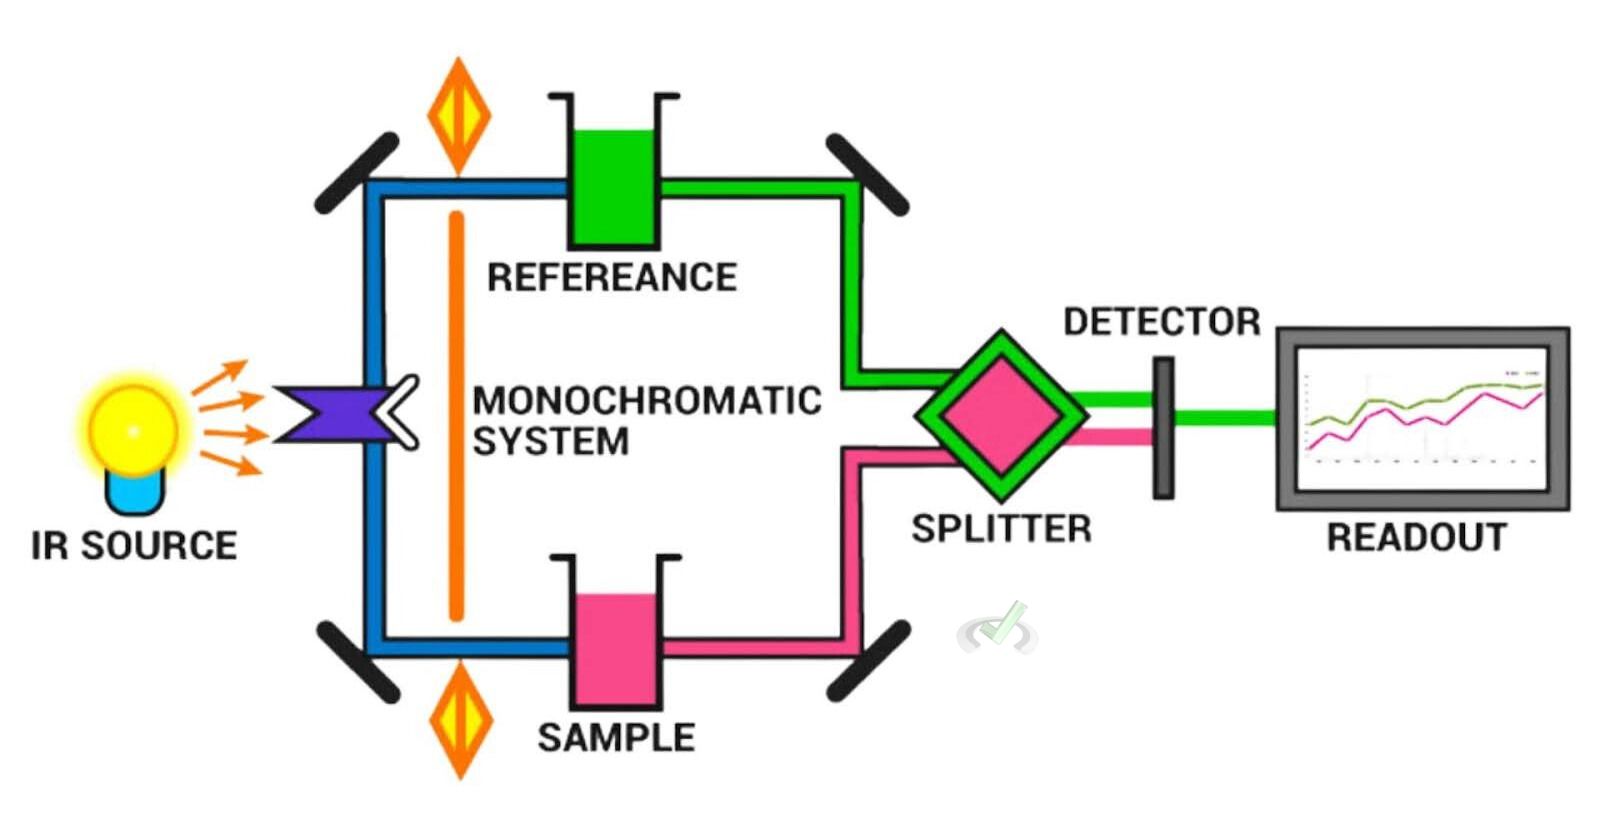
VI. Components of an IR Spectrometer

- Light Source: Produces infrared light from a heated filament or a Globar (a silicon carbide rod).
- Sample Holder: Holds the sample in place during analysis. The holder type depends on the sample's physical state (solid, liquid, or gas).
- Monochromator: Disperses the infrared light into its component frequencies before it reaches the sample.
- Detector: This device measures the intensity of transmitted light and converts it into an electrical signal. Common detectors include thermocouples, bolometers, and pyroelectric detectors.
- Computer: Analyzes the signal from the detector and generates the IR spectrum.
VII. Quantitative Analysis
IR spectroscopy is also used quantitatively to measure concentrations of compounds. The area under a specific absorption peak in the IR spectrum is proportional to the compound concentration in the sample.
This principle is based on the Beer-Lambert Law. It relates the absorption of light to the material's properties through which the light is traveling.
VIII. Limitations of IR Spectroscopy
A. Complex Mixtures
IR spectroscopy may have difficulty analyzing complex mixtures because the spectra can overlap. This makes it challenging to identify individual components in the mixture.
B. Weak Absorptions
Some functional groups may have weak absorptions that are difficult to detect. This can limit the sensitivity of IR spectroscopy in identifying these groups.
IX. Connecting Infrared Spectroscopy to Broader Organic Chemistry Concepts
A. Structural Elucidation
Infrared spectroscopy is essential for determining the structures of organic molecules. It complements other techniques, such as nuclear magnetic resonance (NMR) spectroscopy and mass spectrometry (MS), providing a complete picture of the molecular structure.
B. Functional Group Transformations
IR spectroscopy is useful for studying functional group transformations. For example, monitoring the conversion of an alcohol to a carboxylic acid involves observing the disappearance of the O-H peak and the appearance of the C=O peak.
C. Biochemistry
IR spectroscopy can be combined with chromatographic techniques to separate and identify compounds in a mixture. This is especially useful in complex sample analysis.
D. Chromatograph
Spectroscopy is the study of the interaction between electromagnetic radiation with matter.
X. Wrap-Up and Key Terms
Understanding IR spectroscopy involves grasping several key concepts and principles. Let's review:
Key Terms
- Wavenumber: A measure of frequency used in IR spectroscopy, given in cm⁻¹.
- Transmittance: The amount of light that passes through a sample.
- Functional Group Region: The region of the IR spectrum (4000-1500 cm⁻¹) where functional groups absorb light.
- Fingerprint Region: The region of the IR spectrum (1500-400 cm⁻¹) unique to each compound.
XI. Practice Questions
Sample Practice Question 1
Which region of the IR spectrum is used to identify functional groups?
A. 4000-1500 cm⁻¹
B. 1500-400 cm⁻¹
C. 6000-5000 cm⁻¹
D. 1000-500 cm⁻¹
Ans. A
This region contains peaks corresponding to different functional groups.
Sample Practice Question 2
What type of vibration occurs when the distance between two atoms increases along the bond axis?
A. Bending vibration
B. Stretching vibration
C. Twisting vibration
D. Scissoring vibration
Ans. B
Stretching vibrations involve changes in the distance between atoms along the bond axis.


 To help you achieve your goal MCAT score, we take turns hosting these


